
Commercial solar remains the most geographically concentrated solar segment — nearly 80 percent of 2017 capacity was installed in five key states.
But every commercial solar developer knows that each of those markets is a “unique snowflake." State-specific policies and rate structures lead to each state having its own distinct customer types and project sizes that are economically viable.
Take California, for example. California’s commercial solar market is mostly customer-owned, accounting for 60 to 70 percent of installations for the last several years. This differs from the nationwide trend — more than half of 2017 installations were third-party owned, largely due to increasingly complex state level policies and the rise of community solar. This has increased even further in early 2018 and is expected to reach 66 percent of installations by year's end.
California also has a smaller average project size than the rest of the country, thanks to the former 1-megawatt limit on net metering and its lack of a viable community solar market. Average system sizes in California currently come in at 115 kilowatts — about half of the average national commercial solar project size.
California Commercial Solar Project-Size Trends
Source: GTM Research Solar Data Hub
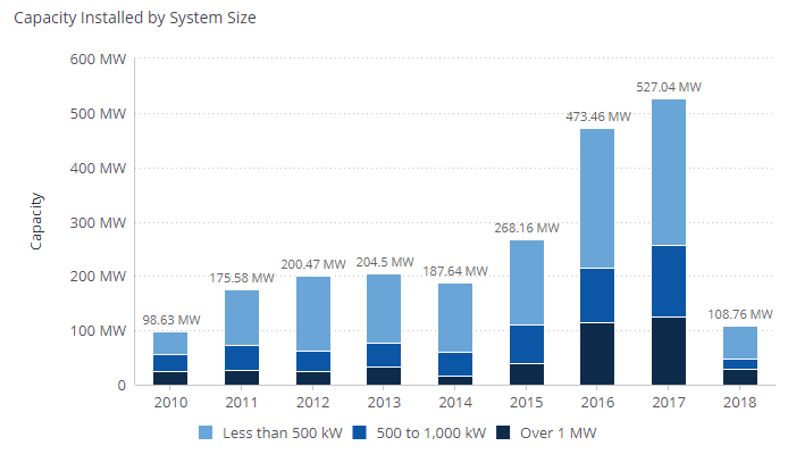
Massachusetts, on the other hand, is quite different. Over 60 percent of commercial solar in the state is third-party owned, and its average system size has skyrocketed in recent years to over 600 kilowatts (thanks to its healthy community solar market).
It’s also one of the most diverse markets in terms of customer types: Community solar, plus onsite and virtually net-metered projects with schools, nonprofits, churches and affordable-housing customers, collectively made up over half of 2017 capacity in the state. In most other states, onsite commercial and industrial (C&I) customers are the most prominent customer type.
Massachusetts Commercial Solar Customer Type Trends
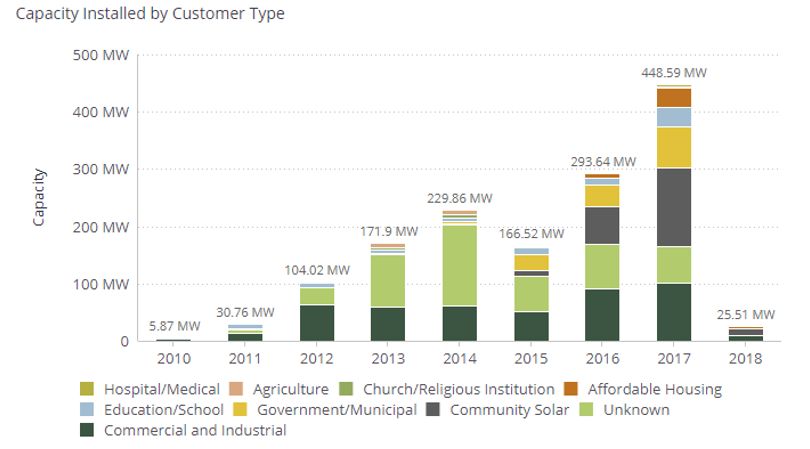
Source: GTM Research Solar Data Hub
New Jersey is one such state. C&I customers have dominated the state’s commercial solar industry, making up 65 to 80 percent of customers in any given year. However, the same types of customers don’t always have the same ownership preferences. New Jersey’s C&I customers overwhelmingly preferred third-party-owned deals several years ago — in 2014, this category accounted for almost 90 percent of C&I deals compared to only 45 percent for the national average. But this preference has been declining since then, accounting for less than half of New Jersey’s C&I deals in Q1 2018.
New Jersey Commercial and Industrial Solar Market
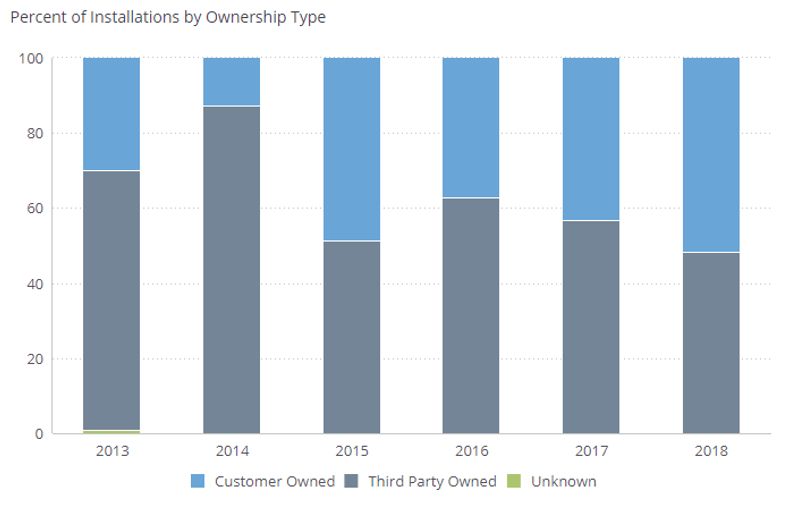
Source: GTM Research Solar Data Hub
These market characteristics are now easy to see on GTM’s Premium Data Hub dashboards. We’ve added customer-type and project-size granularity to our pre-existing dashboard tools, allowing users to look at state and national distributed solar markets by numerous characteristics.
I’ve written previously about the trend of the increasing diversity and complexity in the U.S. commercial solar market. Knowing how that diversity and complexity is evolving will help developers and project financiers better understand what appeals to specific subsets of customers as the commercial solar industry grows.
***
Want to see the Solar Data Hub in action? Learn more and request a demo here.


 41
41
 15
15
 9
9
